MILL RELINING BENCHMARKING SCORECARD
Benchmark your performance with RME’s free scorecard. Using industry data, it provides an indicative score for your reline duration—plus practical insights to reduce risk and improve mill availability.
13 January 2026
In this final instalment of our three‑part series, we explore how MILL RELINE DIRECTOR generates site‑specific predictions using digital replicas of a Customer’s grinding mill and relining activities—across both greenfield and brownfield sites—supporting confident, data-driven decisions that enhance relining safety and mill availability.
Efficient mill relining plays an important role in mill availability—and, by extension, mine site profitability. However, anyone involved in the relining of hard rock grinding mills knows that it can be a highly variable process. This makes it challenging for mine sites to understand and act on measures that will reduce shutdown time, cost and risk, and deliver improved mill availability. In our three-part blog, learn how Discrete Event Simulation (DES) can be used to unearth the answers.
Welcome to the final instalment of our three-part series, where we take a closer look at how we close the data gap between digital simulations and real-world mill relining, so that MILL RELINE DIRECTOR (MRD) can be used as a tool to guide best-practice relining performance.
If you haven’t read the first two instalments yet, you can start here.
Increasing mill availability is a key lever for improving productivity at many mineral processing sites. With mill relining representing on average between 2 – 5% of lost production annually—and sometimes as high as 10%—the economic incentive to shorten maintenance shutdowns is strong. What’s more, shorter relines reduce the number of hours reline crews are exposed to hazardous activities and risk. However, knowing how to achieve these improvements—consistently and repeatably—can be challenging due to the unpredictability of mill relining.
RME is solving this industry challenge with its Discrete Event Simulation (DES) program—MILL RELINE DIRECTOR (MRD)—which produces data-driven insights on how mill operators can improve reline performance and mill availability.
To help our Customers and partners understand the value and reliability of this capability, we have produced a three-article series. Part I discussed how we went about developing the right simulation model for mill relining. Part II discussed how it was necessary to bridge the data gap so we could make predictions with sensible real-world accuracy. In Part III, we explore how MRD produces site-specific predictions using digital replicas of each Customer’s mill and the full sequence of relining activities.
Building the digital twin of the Customer’s physical mill
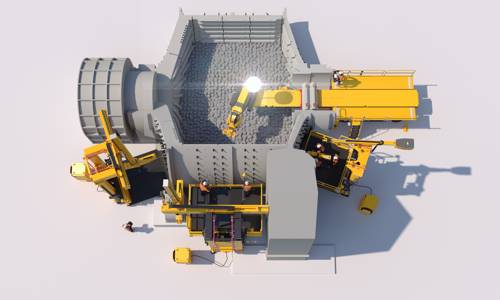
As part of every MRD Study, we begin by constructing a digital software model of the Customer’s SAG, AG, ball, or pebble mill. This software-based model is a digital replica of the actual or planned asset in the field and includes mill type and size, liner design sets, and liner quantities—right down to the exact number of liner bolts, washers and nuts. Digital replicas can be built for both operational (brownfield) and planned (greenfield) grinding mill sites.
An example of the mill and liner reline scope used in modelling a large 36’–40’ SAG mill is shown in the image below.
The real power of this digital twin lies in its granularity. During model construction, even the precise location of each liner or bolt within the mill—along with other critical details—is used to assign expected knock-in resistance across a range of relining conditions. By modelling every component, MRD ensures that variations in liner design sets and fastener types are accurately captured in the simulations, resulting in more precise reline time predictions.

You can read more about this data type in Part I.
Another benefit of a digital replica is that it allows a graphical construction of an ‘inching sequence’ —the precisely planned order in which bolts and liners are removed from the mill. This process is often constrained by access limitations and geometrical differences. The inching sequence can be difficult to predict in advance, and small changes can have a significant impact on the total reline time.
When plans are being developed for future greenfield sites, mill operators typically want to be able to model different scenarios, to assist with making plant design trade-off decisions. Since the mill doesn’t exist yet, the model is built through a discovery process with the Customer, and their mill and liner manufacturers.
If these details are not available, RME is able to propose a range of different common liner arrangements as part of the trade-off study*. RME has a large industry database of actual reline performance data for similar real-world mill scenarios, which is used to validate model constructions.
In the case of an already operational site, RME would usually attend site to film the reline and collect the data required to construct the model.
*Note that when RME proposes liner designs for reline simulation purposes, we only consider the number of liners for each type, and associated fasteners that are required, and are not considering the actual liner grinding geometry and wear patterns that vary between sites. These other factors may have a design feedback loop into the number of pieces for an optimised liner design. The best approach for accurate reline modelling is achieved through collaboration: when a liner OEM provides liner design(s) specific to the project as an input into the construction of the MRD model.
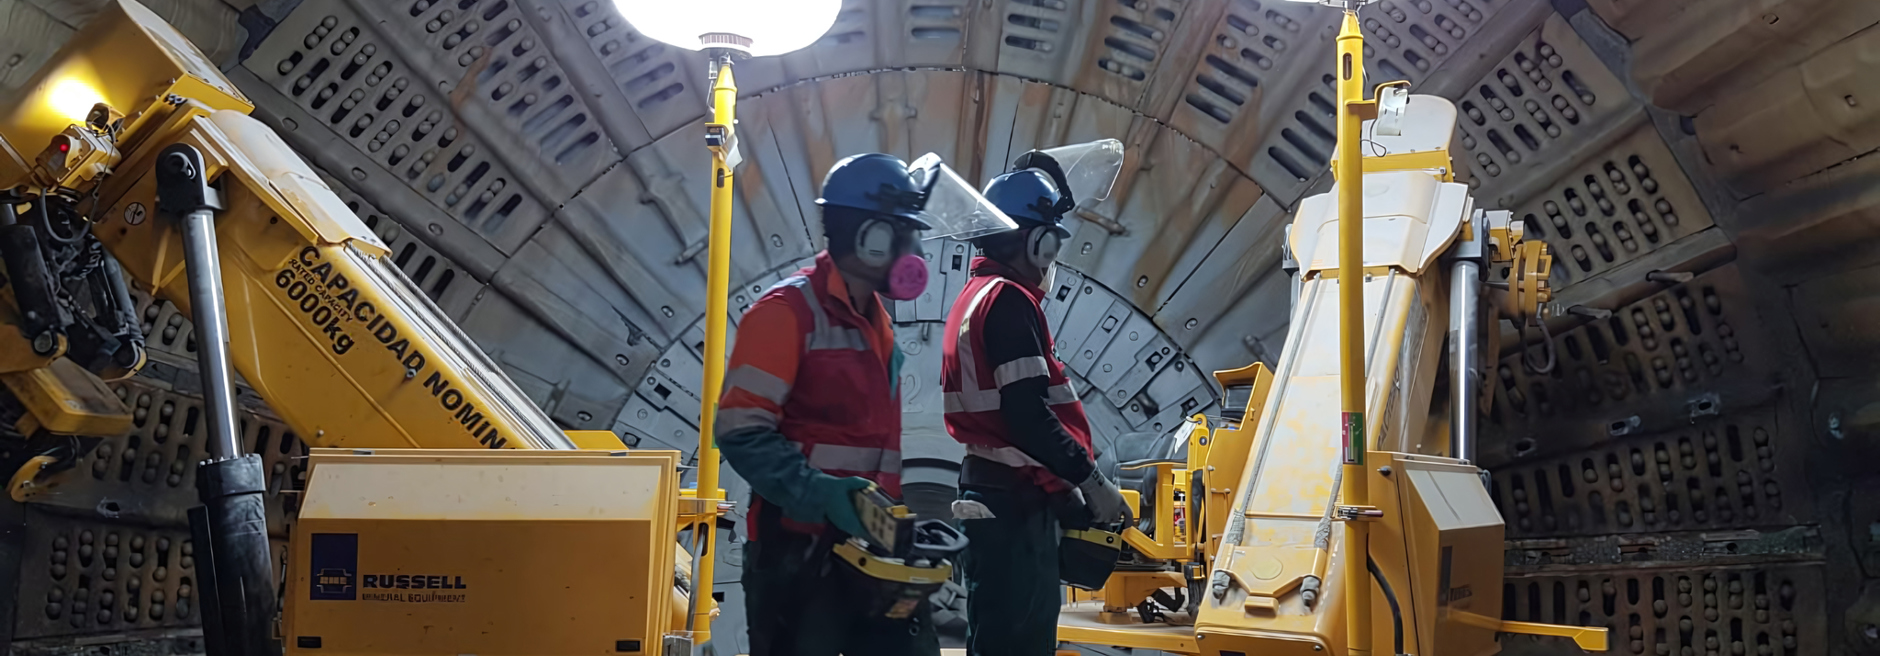
Filming the real-world mill reline
To create a highly accurate digital twin for existing mills, RME’s MRD engineers travel to site during a shutdown to film a real-world reline operation. This involves placing customised video cameras inside and around the mill, to capture every minute of the operation. The video footage is later used to develop site-specific datasets with statistical distributions of the time taken for each activity. These datasets then become inputs to the digital replica.
In addition to capturing film footage, MRD engineers observe reline processes firsthand—gathering qualitative insights to support and contextualise the quantitative data from video footage. This may include identifying plant design or particular site-specific factors, such as mill access constraints, liner supply bottlenecks, or issues with mill drives and forklift operations—details that cannot be explained by video footage alone. Site attendance remains critical, because when it comes to relining, no two sites are the same.
By combining expert site observations with captured filmed data, MRD can identify and produce quantified site-specific improvement recommendations using the digital replica.
Global industry performance benchmarking
After capturing actual reline time data, RME can perform an industry benchmarking exercise of relining performance using our extensive datasets. This gives mill operators a view of their current performance relative to similar operations worldwide. Benchmarking is done by comparing overall reline times achieved as well as individual activity times.
Benchmarking has three benefits. First, it gives Customers an external reference point—helping them understand how they compare to the broader industry and offering some initial clues about where to look for potential improvements. Second, it helps keep the modelling work grounded in real-world conditions. And third, by showcasing illustrative examples, it encourages constructive discussions that challenge the status quo (i.e. 'this is the way things have always been done'), paving the way for relining optimisations.
Trust and validation
The initial, full simulation that MRD runs is what’s called the ‘validation reline’. This is where a scenario is constructed in the model that exactly replicates what has occurred in real life at site. This is built from the data captured during the filming and study of the reline, and includes mill details, liners, relining equipment, crew size, reline work rates, and delays from external factors.
Because the MRD model is built from statistical distributions that reflect the full range of real-world activity times, actual reline time must fall within the predicted range for the model to be considered valid. Completing this step confirms the model’s operational accuracy—ensuring it can be trusted to generate reliable data for subsequent ‘what if’ simulations.
Establishing baseline performance
Now that we have confirmed the model is accurate, the next step is to produce the ‘reference reline(s)’. The reference reline represents the site’s typical baseline reline performance and is built to match the reline schedule over the next 1-3 years. In this way, the model predicts what the site can expect their annualised reline performance to be, should nothing change. This is often reported as a total time spent relining in hours per annum, or the percentage of lost mill availability per annum.
The baseline model can also be used to quantify how many hours the reline crew will be exposed to safety hazards, based on the duration of the reline and the number of workers required in each zone of the mill. This is often reported as person-hours of risk exposure per annum.
Once the baseline models are completed, it is then possible to make changes to the models that consider different ‘what if’ scenarios.
Asking site-specific ‘what ifs’
Now comes the exciting part—adjusting the model to simulate reline time impacts across a range of improvement opportunities. These may include changes to concentrator plant layout, relining equipment, optimised liner design sets, and process refinements such as working on both sides of the mill.
The wide range of questions we can ask were highlighted in Part II of this series. For example, “How much time—and how many crew risk exposure hours—could we save by automating the operation of THUNDERBOLT Hammers using SKYPORT or SKYWAY suspension systems?”
In the case of a filmed study for an operational site, we can also examine the relining processes and methods as levers for improving mill availability. This may involve optimising the liner supply system, reline crew allocation, relining sequence and more. It also could include identifying recurring sources of delays (e.g. mill drive issues) and quantifying how much time could be saved by addressing those issues through targeted investment.
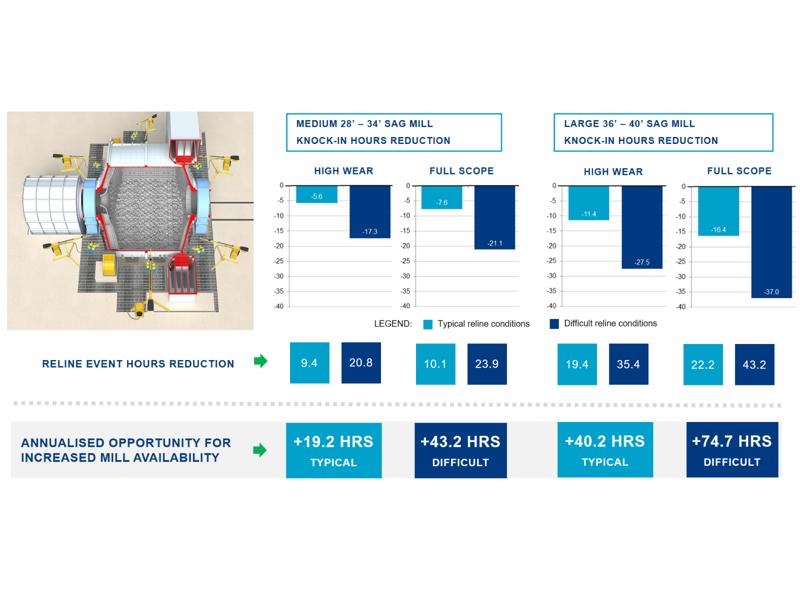
The infographic on the right gives a sense of MRD’s reporting possibilities. The reference reline is indicated by the baseline on all the graphs shown and the performance improvements are the delta in relation to the reference reline simulation results.
You can also watch an animation of an MRD reline operation here.
When filming the reline isn’t possible.
There will be times when filming the reline isn’t possible—for example, at a planned greenfield site. MRD has a solution for this too. Our Desktop MRD Studies will use information from drawings, project data, and similar project experiences to make reasonable assumptions. We also draw on our extensive relining database, which includes data from similar mine sites, locations, mills, ores, and liner types. From here, we calibrate the desktop models up or down to produce the reference reline and run the ‘what if’ simulations.
Of course, MRD Desktop studies are not as accurate as MRD filmed studies, because we can’t be as specific with things like the exact crew experience and relining speed. However, for greenfield projects, a Desktop MRD simulation is the most accurate way to predict reline times and generate data for informed trade-off decisions. Simulations will compare mill availability against various plant layout and capital investment options, allowing for optimised decision-making from the outset.
What can an MRD study do for your site?
Since the program’s release, MRD has helped hundreds of mill operators make better and more informed decisions about maintenance planning and mill availability. Our methodology provides clear line of sight into the complex process of mill relining and serves as a trusted, data-driven independent assessment of plant designs, relining processes, equipment, and crew performance. Moreover, it helps operators build a solid business case to justify CAPEX and OPEX budget requests and investments— because we can clearly demonstrate, with a solid amount of certainty, the economic impacts on annual mill availability and reline safety.
Curious about the impact of MILL RELINE DIRECTOR (MRD)?
RME has published a whitepaper detailing the results of a non-filmed MRD study that quantifies the knock-in effect of THUNDERBOLT MAGNUM Recoilless Hammer technology on reline duration and mill availability. Simulations were conducted across a range of mill scenarios and relining conditions representative of global industry practice. The study revealed annualised reline time reductions of up to 74.7 hours with optimal hammer configuration.
Download the whitepaper to explore the findings.
As John Russell—RME’s Founder—puts it:
“The thing I like best about MILL RELINE DIRECTOR, is that the data enables us to make a promise. We deliver on that promise with the RME Mill Relining System. And then we can return to audit the implementation to ensure ‘we’ve got it’. MRD’s ability to predict and audit real-world reline speed and safety performance – well, that’s the truly defensible stuff.”
Thank you for following our three-part article series on MILL RELINE DIRECTOR. If you have questions about MRD simulations and site-specific studies, the RME Mill Relining System and RME’s Mill Relining Optimisation Program, please reach out to our Applications Engineering team via your nearest Regional Support Centre or email rme@rmeGlobal.com.
To get a sense of where your site compares against industry norms, explore the new RME Mill Relining Benchmarking Scorecard. This intuitive, web-based tool provides an external reference point—indicating how your operation compares to similar mills in RME’s global industry database, and where there may be opportunities to improve safety and performance. To learn more about the Scorecard’s capabilities and its role, read Behind the Benchmark: Fireside Chat with RME Applications Engineering Team.
Benchmark your performance with RME’s free scorecard. Using industry data, it provides an indicative score for your reline duration—plus practical insights to reduce risk and improve mill availability.

MILL RELINE DIRECTOR (MRD) discrete event capture, analysis and 'digital twin' simulation provides clear line of sight into the complex process of mill relining.
Our relentless pursuit to improve safety and productivity has driven us to engineer a future where relining is performed safely from outside the mill – at faster speeds than ever before.