MILL RELINING BENCHMARKING SCORECARD
Benchmark your performance with RME’s free scorecard. Using industry data, it provides an indicative score for your reline duration—plus practical insights to reduce risk and improve mill availability.
06 November 2025
Part II of our three-part series explores how MILL RELINE DIRECTOR analyses and simulates reline events grounded in operational reality, delivering insights to improve crew safety and productivity.

Efficient mill relining plays an important role in mill availability—and, by extension, mine site profitability. However, anyone involved in the relining of hard rock grinding mills knows that it can be a highly variable process. This makes it challenging for mine sites to understand and act on measures that will reduce shutdown time, cost and risk, and deliver improved mill availability. In our three-part blog, learn how Discrete Event Simulation (DES) can be used to unearth the answers.
Welcome to Part II of our three part blog series, where we explore how MILL RELINE DIRECTOR (MRD) bridges the gap between digital simulation and real-world mill relining—delivering insights that guide best-practice performance while staying grounded in operational reality.
If you haven't yet read Part I, you can do so here.
Predictive modelling in mill relining offers a powerful way to explore future scenarios and optimise decision-making. It enables us to ask important ‘what if’ questions and forecast the outcomes of future events.
For example, when evaluating the liner design sets for a 36-foot SAG mill: “What is the impact of reducing the number of liner pieces on my annual mill availability?”
Or: “What is the optimal configuration of THUNDERBOLT MAGNUM Recoilless Hammers to minimise knock-in duration and reduce risk?”
Or: “If we’re investing in improved relining safety and performance, which options will deliver the greatest return on investment?”
Or, “How many additional production hours could by unlocked with an improved plant design that optimises mill relining, and do the modification costs justify the investment?”
Or: “How much time—and how many crew risk exposure hours—could be saved by implementing the RUSSELL Claw for muck-out?”
Clear answers to these types of questions are critical when making investment decisions in capital equipment, new processes, or emerging technologies.
Insights are also essential when modifying well-established maintenance crew practices and managing the economic risks to downtime and safety associated with change initiatives.
In these situations, confidence in the accuracy of the projected benefits and costs becomes a decisive factor for decision-makers when evaluating their options.
That’s why predictive modelling—grounded in real-world data and calibrated for practical accuracy—gives mine sites greater confidence in the validity of their decisions.
Historically, however, there have been differences between the outputs from conventional simulation methodologies and real-world practice, due to the dynamic and variable nature of mill relining.
And so, we need to bridge the data gap.
Simulating the complexity and unpredictability of mill relining
There are several ways MILL RELINE DIRECTOR (MRD) bridges this data gap and simulates reline events with credible alignment to real-world conditions.
Firstly, MRD can model relines with greater certainty because real-world complexity and variability is embedded in the data and construction of all the discrete activity events in the model.
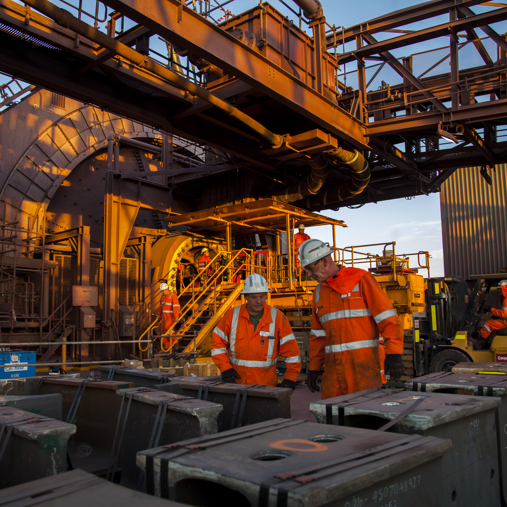
RME’s relining performance datasets have been 'mined’ from thousands of hours of video recordings, combined with meticulous first-hand study of reline operations across a wide range of Customer sites globally.
Our studies have produced a comprehensive list of the primary variables that must be considered in the discrete event modelling of relining, along with an understanding of the interactions between them.
Additionally, it is essential for accuracy that these variables are treated as discrete time frequency distribution curves—not as overall average times.
Here is a simplistic example: If the average time taken for RUSSELL Mill Relining Machine (MRM) to retrieve a worn liner is 75 seconds, and the average time taken for the liner cart to return to pick up the liner is 74 seconds, it may appear the RUSSELL MRM never waits for the liner cart.
However, when we investigate real-world variability, we find that on some occasions the RUSSELL MRM may wait up to 250 seconds for the liner cart—a result of the high variability (standard deviations) associated with certain relining activity times.
To account for this, MRD data and modelling techniques assign time to an event based on its statistical distributions for each appropriate variable.
This type of relationship is repeated throughout the reline a myriad of times and illustrates why this simulation methodology is necessary to provide sensible real-world insights.
In fact, around 50,000 discrete reline activities have been recorded—with associated meta-data—for inclusion in MRD’s reline model.
You can also watch an animation of an MRD reline operation here.

Additionally, every time RME conducts a filmed MRD site study, performance data is collected and confidentially stored in the program’s memory. It’s currently estimated that the MRD database contains over 45,000 hours of real-world reline footage.
Verification and validation
With each new MRD study conducted at a Customer site, RME regularly evaluates MRD’s outputs to ensure the simulation outcomes are consistent with the performance that is being achieved in real-world conditions. Not only does RME maintain a database of individual reline activities, but also overall reline times achieved by a range of Customers around the world to support ongoing verification and validation.
RME also uses physical testing where possible, to verify the inputs to the modelling.
As one example of this, to simulate the superior performance when a larger recoilless hammer is applied to liner bolts that are stuck or have a high resistance, RME built a physical hammer test rig.
Our R&D Engineering team then conducted multi-week testing to compare the relationship between blow energy and knock-in efficiency.
This led to the discovery that a non-linear mathematical model was needed to accurately represent knock-in scenario simulations.
This mathematical model enables MRD to quantify the impact of substituting hammers with various power levels for a variety of relining scenarios—including typical or difficult reline conditions—in terms of knock-in duration, crew resourcing and safety outcomes.
Trusted sense-making technology
It is this unique application of Discrete Event Simulation in RME’s MRD program which truly simplifies the complex and makes it tangible. It gives our Customers a clear line of sight into the nuanced, logistically-challenging process of mill relining and enables them to ask important ‘what ifs’.
In doing so, it provides mine sites with unparalleled, highly-granular insights into improving relining duration, maintenance predictability and mill availability—and most importantly, with trusted real-world accuracy.
Up next in our third and final instalment, we dig deeper into MRD’s graphical ‘digital replica’ reline configuration tool, which enables site-specific simulation insights. We also walk through the MRD Study process for both brownfield and greenfield sites, showing how RME Customers use it to optimise mill relining safety and performance.
If you have questions about MRD simulations and site-specific studies, the RME Mill Relining System and RME’s Mill Relining Optimisation Program, please reach out to our Applications Engineering team via your nearest Regional Support Centre or email rme@rmeGlobal.com.
To get a sense of where your site compares against industry norms, explore the new RME Mill Relining Benchmarking Scorecard. This intuitive, web-based tool provides an external reference point—indicating how your operation compares to similar mills in RME’s global industry database, and where there may be opportunities to improve safety and performance. To learn more about the Scorecard’s capabilities and its role, read Behind the Benchmark: Fireside Chat with RME Applications Engineering Team.
Benchmark your performance with RME’s free scorecard. Using industry data, it provides an indicative score for your reline duration—plus practical insights to reduce risk and improve mill availability.

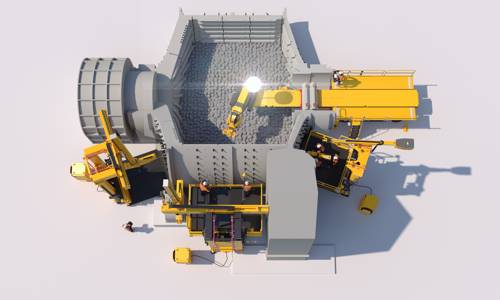
MILL RELINE DIRECTOR (MRD) discrete event capture, analysis and 'digital twin' simulation provides clear line of sight into the complex process of mill relining.
Our relentless pursuit to improve safety and productivity has driven us to engineer a future where relining is performed safely from outside the mill – at faster speeds than ever before.